What you give it
A spreadsheet of polls — one row each, with the date, which firm ran it, how many people were asked, and every party's score. That is the whole input.
kronikas reads opinion polls and works out what they actually support: where each party stands, how much of the gap between them is one polling firm's habits rather than real movement, and how likely each result is on election day. Every answer comes as a range with a probability attached, so you can see how solid the picture really is — not just where it points.
01 In plain terms
A spreadsheet of polls — one row each, with the date, which firm ran it, how many people were asked, and every party's score. That is the whole input.
Each party's likely vote share, the range it could plausibly fall in, and the probability it finishes first — plus a read on which polling firms lean which way, separated out from real changes in opinion.
It is a Python package, not a website or an app: running it takes a little code. And it forecasts vote share, not seats — where there are districts, runoffs or coalitions, finishing first is not the same as taking power.
Running in production
Live Hungarian election forecasts, tracking real polling shifts as they happen — the same package you install below, on real data, in public.
02 The problem
Most aggregators reduce a rich, noisy record into one number and stop. That number can't tell you how close the race really is, how much of the gap is one firm's habitual lean rather than real support, or what it would take for the call to be wrong.
What an aggregator reports
One point. No spread, no correlation between parties, no way to ask how likely a lead is to survive to election day.
What kronikas reports
90% CI 38.1 – 47.3 · P(plurality) 91%
Most likely 42.7%; realistically anywhere from 38 to 47; a 91% chance of finishing ahead of everyone else.
A joint posterior over every candidate — so any question you can phrase as a probability has an answer, with the uncertainty already in it.
03 What you get
Answers arrive as odds, not verdicts. Full posterior distributions, plurality probabilities, threshold probabilities and head-to-head leads — each with calibrated uncertainty attached.
Some firms lean one way, election after election. Each firm's systematic lean is estimated from the data and separated from genuine opinion shifts. Zero-sum by construction, so "bias" always means relative to the industry.
Vote shares can never come out negative, or add up to 103%. Dirichlet observations and a softmax constraint guarantee shares stay non-negative and sum to exactly 100%. No ad-hoc renormalisation after the fact.
If you know something the polls do not, you can say so. Per-pollster priors, adjustable time grids, correlated random walks, directional bias beliefs — and an escape hatch to any pymc.sample() keyword.
04 Inside the model
The short version: opinion drifts rather than jumps, so the model tracks a slow underlying trend; it learns each firm's lean separately; and it treats every poll as noisier than its sample size alone would suggest. Every assumption is written down, and every one is yours to change.
The detail below is for anyone who wants to check those assumptions. Nothing later on depends on reading it.
Candidate shares are parameterised as K−1 log-ratios that evolve as a Gaussian
random walk on a discretised time grid, then mapped back through a softmax. The
grid is anchored backwards from election day, so its final node lands
exactly on the date you care about — no stray partial step of drift. Volatility
is expressed per walk_reference_days, so changing the resolution
doesn't quietly change the prior.
Every pollster carries a bias term in log-ratio space, drawn from a zero-sum Normal prior. The constraint holds across both candidates and pollsters, which removes unidentifiable sampler dimensions and pins the meaning of each effect: this firm, relative to the industry average. Trust a firm more, or encode a lean you already know about, with a per-pollster override.
Each poll is modelled as
Dirichlet(kappa_scale × sample_size × latent_shares). The learnt
kappa_scale absorbs the overdispersion that pure multinomial sampling
misses — design effects, non-response, weighting — so a 2,000-respondent poll
isn't automatically treated as twice as informative as a 1,000-respondent one.
05 Without writing code
Everything below this section assumes Python. This one does not. The package ships a guided workflow — plain-language settings, one command, and a report written to be read rather than decoded — plus a skill that hands the whole thing to an AI assistant, which asks the questions and explains the answers.
pip install kronikas, then kronikas skill install copies
the skill into ~/.claude/skills/. Claude Code — or any assistant you
paste SKILL.md into — then runs the interview: what the election is,
where, which polls, and what you believe about the pollsters.
How fast opinion moves is calm, normal or
volatile. A firm you distrust gets trust: low. The one
thing no model can learn — how wrong every pollster might be at once — is a
number you set, and the workflow asks for it every time. Prefer clicking?
kronikas form polls.csv builds a page with a control for every party
and firm in your own file.
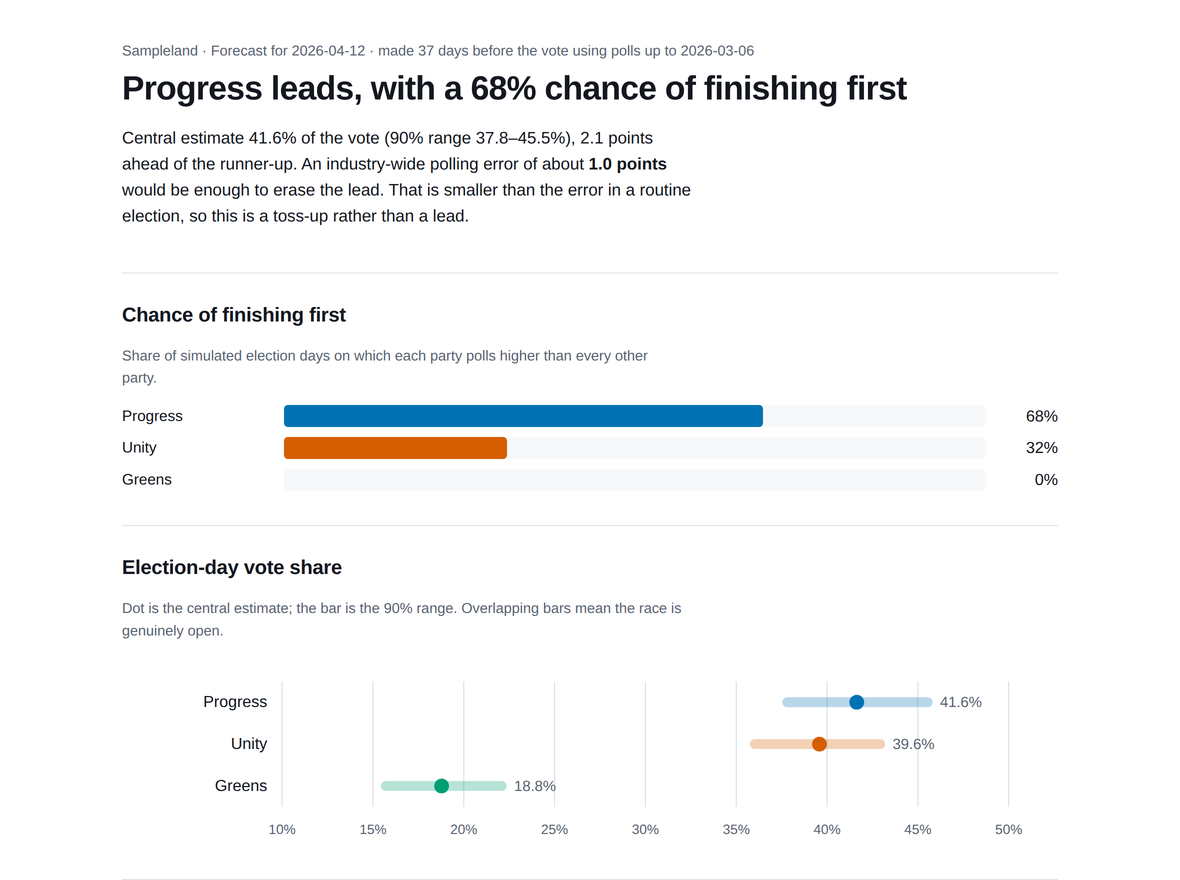
kronikas guided forecast.yaml writes a self-contained
report.html: win probabilities, forecast ranges, the trend with the
polls behind it, each firm's lean, and the smallest industry-wide error that
would erase the lead. It states its own health in words, and says plainly what
"most votes" is worth under your electoral system.
kronikas skill install
How it works
06 In practice
One row per poll: a date, a pollster, a sample size, and a column per candidate. Everything else is a keyword argument.
Code from here on. If you are not the person who will run it, the guided workflow needs none of it — or skip to what the model cannot see.
from kronikas import ElectionForecast

forecast = ElectionForecast(
    polls_csv="polls.csv",
    election_date="2024-11-05",
)
result = forecast.run()

# Point estimates with honest intervals
for est in result.today_estimates:
    print(f"{est.name}: {est.mean:.1f}% "
          f"({est.ci_lower:.1f}–{est.ci_upper:.1f})")

# P(this candidate polls highest on election day)
result.win_probabilities        # {'Alice': 0.91, ...}

# P(clears a 5% electoral threshold)
result.threshold_probabilities(5.0)

# Head-to-head, and every posterior draw as a DataFrame
result.lead_probability("Alice", "Bob")
result.party_forecast_dataframe(day="election_day")
result.house_effects_dataframe()

# Sampling takes minutes — keep the run
result.save("forecast-2024-03-20.nc")
Already have a DataFrame? ElectionForecast.from_dataframe(...) skips the CSV round-trip and never mutates the frame you pass it.
# Human-readable summary
kronikas forecast polls.csv --election-date 2024-11-05

# Machine-readable, quiet enough for cron
kronikas forecast polls.csv \
    --election-date 2024-11-05 \
    --threshold 5 --threshold 10 \
    --json forecast.json \
    --save-trace forecast.nc \
    --quiet

# How fragile is the call to an industry-wide error?
kronikas forecast polls.csv \
    --election-date 2024-11-05 \
    --shared-bias 2 --shared-bias 4

# Non-ISO dates, European decimals, renamed columns
kronikas forecast polls.csv \
    --election-date 2024-11-05 \
    --date-format "%d/%m/%Y" --decimal ,
kronikas forecast exits non-zero when the sampler reports a convergence problem — a scheduled run fails loudly instead of publishing bad numbers.
from datetime import date
from kronikas import backtest

# Replay the campaign: at each as-of date, throw away
# every later poll, refit, and score what it would have said.
report = backtest(
    "polls.csv",
    election_date=date(2024, 11, 5),
    as_of_dates=[date(2024, 8, 1), date(2024, 10, 1)],
    actual={"Alice": 48.2, "Bob": 47.1, "Carol": 4.7},
)

print(report.summary())
report.to_dataframe()   # one row per (as-of, candidate)
report.metrics()        # MAE, RMSE, CRPS, hit rate, bias
Bias is reported per candidate, never pooled: shares sum to 100, so signed errors cancel exactly across candidates and a pooled mean would be identically zero.
from kronikas import ModelConfig, PollsterPrior

config = ModelConfig(
    # --- Sampler ---
    num_tune=2000, num_draws=2000, num_chains=4,
    target_accept=0.99,
    init_method="adapt_full",

    # --- Time grid ---
    time_step_days=3,          # finer trend resolution

    # --- Priors, on the logit scale ---
    sigma_walk_prior=0.03,      # smoother trend
    sigma_house_prior=0.2,      # tighter house effects
    correlated_walk=True,      # LKJ-correlated innovations

    # --- What you already know about specific firms ---
    pollster_priors={
        "PollCo": PollsterPrior(mu_house={"Alice": 3}),
        "SurveyInc": PollsterPrior(kappa_log_sigma=1.0),
    },

    # --- Escape hatch to any pymc.sample() kwarg ---
    sampler_kwargs={"nuts_sampler": "nutpie"},
)
Prior means are given in percentage points and converted relative to each candidate's own support level — you state beliefs in the units you actually think in.
07 The part nobody advertises
A bias that every pollster shares is invisible to this model — and to any model fitted to a single election's polls.
Put plainly: if every polling firm is wrong in the same direction — as happened in more than one recent election — nothing in the data can reveal it. Worse, the model will sound more confident, not less, because it reads the firms' agreement with each other as accuracy. This is not a flaw kronikas can fix. It is a limit of what polls from a single election can tell anyone, and the page you are reading is where it gets said out loud.
The likelihood is exactly unchanged by shifting the latent trend one way and all
house effects the other. No quantity of polls, and no number of firms, can measure
it. Worse: sigma_house is learnt from how much pollsters differ from
each other, so when they all lean the same way the model concludes they
are all accurate, passes their common error straight through — and reports a
narrower interval, because it reads their agreement as precision.
House effects cannot show you this; their average is pinned near zero however large the common error is. There is no diagnostic for it. So kronikas does the only honest thing available: it lets you price the error you cannot measure.
# "Suppose the polls overstate Alice by 3 pp."
# Re-prices the call along the likelihood ridge — no refit.
result.assume_shared_bias({"Alice": 3.0})

# The smallest industry-wide error that would erase the lead
result.shared_bias_breakeven()

# Or build the belief into the model, centre and spread both
ModelConfig(shared_bias=SharedBiasPrior(
    mean={"Alice": 2.0, "Bob": -2.0},
    sd={"Alice": 1.5, "Bob": 1.5},
    default_sd=2.5,
))The probability the model assigned to the wrong side, on a synthetic dead heat (truth 45–45) where every pollster shaded 3 pp one way. Its 90% interval excluded the truth. That failure is documented, not hidden.
assume_shared_bias() shifts the posterior along a ridge the data cannot distinguish, so a shifted answer fits the observed polls exactly as well. Matched a full refit to within 0.05 pp on synthetic checks.
Typical historical polling error in comparable races — the scale you should supply. It must come from past election results, the only data that can identify it; estimated hierarchically from the same polls it collapses to zero and the term goes inert.
08 Evidence, not assertion
So kronikas can be marked against elections that have already happened: rewind to a date during the campaign, hide every poll published after it, and check what the model would have said against what actually occurred.
Replay the campaign. For each as-of date, discard every later poll, refit, and score what the model would have said.
Accuracy vs. actual result
--------------------------
  MAE           1.34 pp
  RMSE          1.71 pp
  Mean CRPS     1.02 pp
  90% hit rate   88.9%  (descriptive; many
                 elections are needed for calibration)

Signed bias by candidate
------------------------
  Alice                +0.82 pp
  Bob                  -0.61 pp
Carol -0.21 ppEvery result carries the sampler statistics, and raises a ConvergenceWarning when chains misbehave — so a script can't print confident numbers from a fit that never mixed.
Sampling diagnostics
--------------------
  chains x draws     4 x 2000
  max R-hat          1.0021 (sigma_walk)
  min ESS (bulk)     1842 (kappa_log)
  min ESS (tail)     2104
  divergences        0
  status             OK
A single-chain run reports converged=True with a note, not a pass:
one chain leaves convergence unverified rather than demonstrating a problem.
The distinction is the whole point.
09 Get started
Apache-2.0, typed, tested on Python 3.10 through 3.12, and citable. Contributions of every size are welcome.
pip install kronikas
Read the docs
Questions about the model, or want to use it for your own election coverage? Write to vtisza@gmail.com or find me on LinkedIn. Bugs and feature requests are better as a GitHub issue, where everyone can read the answer.
@software{Tisza_kronikas_2026,
  author    = {Tisza, Viktor},
  title     = {kronikas},
  year      = {2026},
  publisher = {Zenodo},
  doi       = {10.5281/zenodo.19163741},
  url       = {https://github.com/vtisza/kronikas}
}